

AI coding tools have changed the way developers investigate software problems.
A few years ago, debugging with AI often meant copying an error message into a chatbot and asking, “What does this mean?” Today, some AI development tools can inspect a repository, follow code across multiple files, analyze failing tests, suggest fixes, and in some cases run commands or make changes themselves.
But there is an important distinction:
An AI coding assistant is not automatically a good AI debugging tool.
Writing code and debugging code are different tasks.
When you are debugging, you are trying to answer five questions:
- What went wrong?
- Where did it go wrong?
- Why did it happen?
- What is the safest fix?
- How can you verify that the fix actually works?
This guide compares popular AI debugging tools based on those questions rather than simply ranking them by how well they generate code.
Quick answer: Cursor is a strong all-around choice for local development, while Claude Code is particularly useful for terminal-based and repository-wide investigation. GitHub Copilot is a natural choice for developers already working heavily with GitHub and supported IDEs. Sentry is more appropriate when the problem occurs in production, and CodeRabbit is focused on finding issues during code review.
Important: AI tools, features, limits, and pricing change frequently. Always check the provider’s current documentation before purchasing a plan.
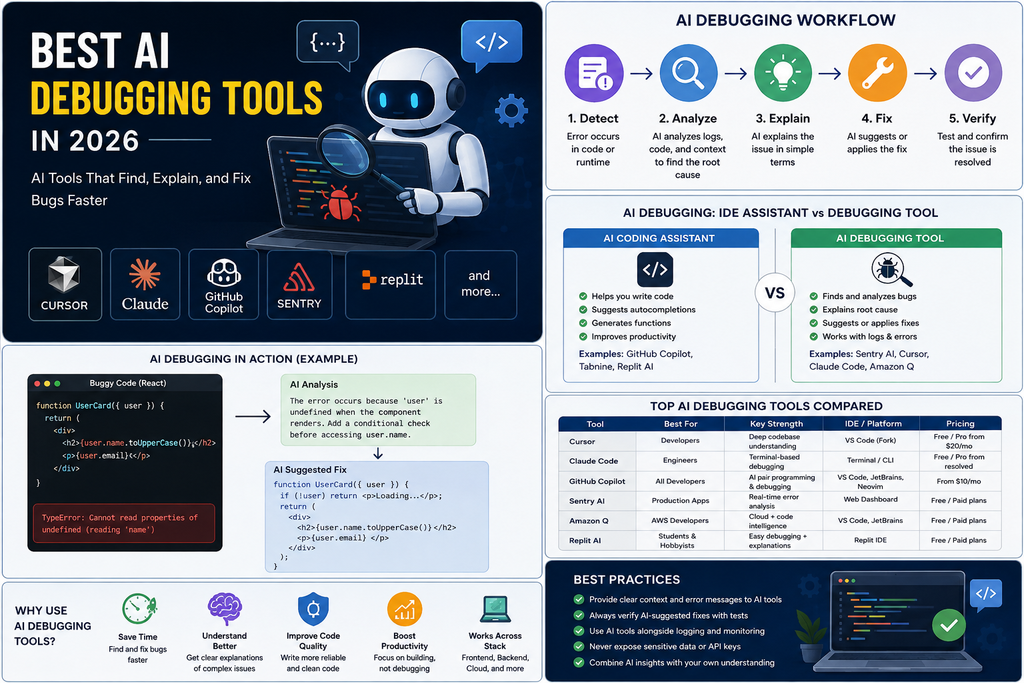
Best AI Debugging Tools
| Tool | Best for | Main strength | Best environment |
|---|---|---|---|
| Cursor | Overall AI-assisted debugging | AI-native editor and repository context | Local development |
| Claude Code | Complex debugging | Terminal and repository investigation | CLI/terminal |
| GitHub Copilot | GitHub-based development | IDE and GitHub integration | IDE + GitHub |
| Sentry | Production debugging | Runtime error and observability context | Production |
| CodeRabbit | Code review | Finding problems before merge | Pull requests |
| Aider | Git-based development | Terminal and Git workflow | CLI |
| Continue | Custom AI workflows | Flexible/open-source setup | IDE |
| Amazon Q Developer | AWS development | AWS ecosystem integration | AWS projects |
| Windsurf | AI-native coding | Agentic development workflow | IDE |
| Sourcegraph Cody | Large codebases | Code search and repository context | Large repositories |
There is no universal winner. The right tool depends largely on where your bug occurs and what information is available to investigate it.
A typical AI-assisted debugging process looks like this:
Error → Context → Investigation → Root cause → Fix → Test → Verification
The most important part is not the generated code.
It is the investigation that happens before the code is changed.
How AI Debugging Works
Consider this Python error:
KeyError: 'user_id'
A basic AI response might explain that Python is trying to access a dictionary key that does not exist.
That explanation is useful, but it is not necessarily debugging.
A stronger debugging workflow would investigate:
- Where is
user_idaccessed? - Where is the dictionary created?
- What data does the API return?
- Can
user_idlegitimately be missing? - Was the data structure recently changed?
- Which function passes the value to the failing code?
- What should the application do when the value is missing?
Only after answering those questions should the tool recommend a fix.
That is the difference between explaining an error and debugging an application.
What Can AI Debugging Tools Analyze?
Error messages
AI can explain common errors and identify likely locations in the source code.
Stack traces
A stack trace provides a sequence of function calls leading to an exception. Giving the complete stack trace is usually more useful than copying only the final error message.
Failing tests
Tests provide an objective target.
Instead of asking:
“Why doesn’t my application work?”
you can ask:
“This test expected X but received Y. Find the cause and propose the smallest fix.”
That is much easier for an AI system to reason about.
Logs
Logs can reveal information that is not visible in the source code, such as:
- Request IDs
- Database failures
- API responses
- Timing information
- Authentication failures
- Service errors
Repository structure
Many real bugs involve multiple files.
For example:
React component
       ↓
API request
       ↓
Node.js controller
       ↓
Service
       ↓
Database
The error may appear in the React component while the actual problem is in the API response.
Repository-aware tools can be useful in situations like this because they can investigate the relationships between files instead of looking at one code snippet in isolation.
Runtime and production data
Production debugging requires additional evidence.
A production failure may depend on:
- A particular user
- A specific database record
- Traffic volume
- Environment variables
- A deployment
- Network conditions
- A third-party service
This is why production-focused debugging tools are different from ordinary AI coding assistants.
AI Coding Assistant vs. AI Debugging Tool
These terms are often used as if they mean the same thing.
They do not.
What Is an AI Coding Assistant?
An AI coding assistant generally helps developers create and modify software.
Typical capabilities include:
- Code completion
- Code generation
- Refactoring
- Documentation
- Code explanation
- Test generation
- Chat-based assistance
What Is an AI Debugging Tool?
Debugging starts with an existing problem.
The workflow is closer to:
Failure → Investigation → Root cause → Fix → Verification
The tool may need to inspect code, logs, tests, Git changes, dependencies, or runtime information.
The Difference
| Capability | Coding assistant | Debugging workflow |
|---|---|---|
| Code completion | ✓ | Sometimes |
| Generate code | ✓ | Sometimes |
| Explain code | ✓ | ✓ |
| Explain error messages | ✓ | ✓ |
| Analyze stack traces | Sometimes | ✓ |
| Investigate multiple files | Depends on tool | Important |
| Investigate failing tests | Sometimes | Important |
| Run tests/commands | Depends on tool | Important |
| Analyze production errors | Usually limited | Specialist tools |
| Suggest fixes | ✓ | ✓ |
| Verify fixes | Limited | Critical |
The distinction matters because a tool can be excellent at generating a new function without being particularly good at investigating a complicated production failure.
How We Compared the AI Debugging Tools
Rather than ranking tools simply by popularity, a useful comparison should look at the actual debugging workflow.
We recommend evaluating each tool on the following criteria.
Root-cause analysis
Can the tool investigate beyond the first visible error?
Codebase understanding
Can it follow a problem across multiple files and components?
Stack-trace analysis
Can it turn an error trace into a useful investigation?
Testing and verification
Can it work with existing tests and help determine whether a fix actually works?
Fix quality
Does it make a focused change or rewrite unrelated parts of the application?
Production debugging
Can it work with runtime evidence such as logs, traces, or production errors?
IDE or terminal integration
Does it fit naturally into the way you already develop software?
Privacy and security
How does the service handle source code, prompts, logs, and other potentially sensitive information?
Cost
Does the tool provide enough value for your particular workload?
A practical scoring model
If you conduct your own hands-on comparison, this weighting is a useful starting point:
| Criterion | Weight |
|---|---|
| Root-cause analysis | 20% |
| Fix accuracy | 20% |
| Codebase understanding | 15% |
| Testing and verification | 15% |
| Stack-trace analysis | 10% |
| IDE/CLI integration | 5% |
| Security/privacy | 5% |
| Price/value | 10% |
| Total | 100% |
Editorial note: The recommendations below are based on documented capabilities and intended use cases. They should not be interpreted as a claim that every tool was independently benchmarked by this publication. If you later perform hands-on testing, add your test cases and measured results to make the comparison even stronger.
10 Best AI Debugging Tools in 2026
1. Cursor — Best Overall AI Debugging Tool
Cursor is an AI-focused code editor built around AI-assisted software development.
Its biggest advantage for debugging is that the AI can work inside the development environment rather than requiring developers to repeatedly copy small code fragments into a separate chatbot.
Why Cursor is useful for debugging
Cursor is particularly useful when a bug involves:
- Multiple files
- Unfamiliar code
- Recent changes
- Tests
- Refactoring
- Dependencies
- Repository-wide context
Cursor also provides Bugbot for pull-request reviews. Its current documentation says Bugbot analyzes PR diffs, identifies bugs, security issues, and code-quality problems, and can provide fix suggestions. It can also use an agent to automatically address reported issues when Autofix is enabled.
A practical example
Suppose a React application crashes after receiving Firebase data.
Instead of asking:
“Why is this React code broken?”
you could ask the agent to:
Trace the data from the Firebase request to the component rendering it. Identify where the expected property can become undefined, explain the root cause, and propose the smallest fix. Then run the relevant tests.
That gives the AI a specific investigation rather than an open-ended request to rewrite the component.
Pricing
Cursor currently offers a free Hobby plan and a $20/month Pro plan. It also has an India-only Start plan priced at ₹649 per month, tax inclusive. The Start plan was introduced in July 2026.
Cursor’s pricing has usage-based components, so the subscription price alone does not necessarily represent total cost for heavy agent users.
Pros
- Strong AI-native development workflow
- Useful for multi-file investigations
- Agentic capabilities
- Integrated code review through Bugbot
- Good fit for everyday development
Cons
- Heavy AI usage can increase costs
- AI suggestions still require review
- Not a replacement for production observability
Best for
Developers who want an AI-powered editor that can assist throughout the local debugging workflow.
Verdict: Best overall choice for many developers doing local, repository-based debugging.
2. Claude Code — Best for Complex and Terminal-Based Debugging
Claude Code takes a terminal-first approach.
That makes it particularly interesting for developers who are comfortable working with Git, test runners, package managers, build tools, and command-line utilities.
Why terminal access matters
Real debugging often involves commands such as:
npm test
npm run build
git diff
pytest
npm run lint
php artisan test
A terminal-oriented AI agent can incorporate the results of those commands into its investigation.
Example workflow
Imagine a developer reports:
The API test started failing after yesterday's commit.
A useful agent workflow could be:
- Inspect the recent Git changes.
- Run the failing test.
- Read the failure.
- Find the related implementation.
- Inspect surrounding code.
- Propose a hypothesis.
- Make a focused change.
- Run the test again.
- Run related tests.
- Show the final diff.
That is much closer to how an experienced developer debugs software.
Best for
- Terminal users
- Large repositories
- Git workflows
- Test-driven investigation
- Developers comfortable reviewing code changes
Limitation
Beginners who prefer a graphical development environment may find a terminal-first workflow less approachable.
Verdict: A strong option for developers who want an AI agent working alongside their terminal and development tools.
3. GitHub Copilot — Best for GitHub and IDE Workflows
GitHub Copilot is designed to fit into development environments and the broader GitHub workflow.
It can assist with:
- Code explanations
- Code changes
- Tests
- Refactoring
- Debugging
- Agentic development
- Pull-request workflows
Why GitHub integration matters
If your team already uses GitHub for:
- Issues
- Pull requests
- Code review
- Branches
- Repository management
then having AI assistance in that ecosystem can reduce context switching.
Best for
GitHub-heavy development teams and individual developers who want AI assistance inside their existing IDE and Git workflow.
Limitation
Copilot is a broad development assistant rather than a dedicated production observability platform.
If your main problem is investigating a failure affecting real users, you may need a tool that has direct access to runtime evidence.
Verdict: A strong all-purpose option for developers already invested in GitHub.
4. Sentry — Best for Production Debugging
Sentry is different from the AI coding assistants above.
Its strength is not primarily writing code.
Its strength is understanding what is happening inside a running application.
Why production debugging is different
Suppose your application works perfectly on your computer but starts returning errors for a small percentage of users after deployment.
A code editor may tell you what the code does.
It may not tell you:
- Which users are affected
- Which deployment introduced the issue
- Which requests failed
- Whether the problem is isolated to one endpoint
- What happened immediately before the exception
Production observability can provide that missing context.
Sentry’s Seer uses available issue and runtime context to help investigate root causes and can assist with suggested fixes and pull-request workflows.
Best for
- Production applications
- Web applications
- API services
- Error monitoring
- Incident investigation
- Teams that already use observability
Limitation
Sentry is not intended to replace an AI coding environment.
Verdict: One of the strongest choices when your biggest debugging problems happen after deployment.
Application Performance Monitoring & Error Tracking Software | Sentry
5. CodeRabbit — Best for AI Code Review
CodeRabbit approaches debugging from a prevention perspective.
Instead of waiting for a bug to reach production, it analyzes code changes during the review process.
How that helps
Imagine a developer changes:
if (user) {
    processPayment(user);
}
to:
processPayment(user);
The code may look harmless in a quick review.
An AI reviewer can potentially identify that the change removes a condition and may cause failures when user is unavailable.
The goal is to catch problems before the code is merged.
Best for
- Pull requests
- Team code review
- Bug prevention
- Pre-merge quality checks
Limitation
Code review is not the same as interactive debugging.
If an application is already failing, an IDE or terminal agent may be more useful.
Verdict: A useful second layer of defense before code reaches production.
AI Code Reviews | CodeRabbit | Try for Free.
6. Aider — Best for Git-Based Development
Aider is a terminal-based AI coding tool designed to work with existing repositories and Git workflows.
Why Git matters for debugging
Debugging often involves experimentation.
You might make a change, run a test, discover another problem, and then revert the change.
Git gives you a clear record of those experiments.
Aider can be attractive to developers who prefer:
- Terminal workflows
- Git
- Existing repositories
- Flexible model choices
- Open-source tooling
Limitation
The terminal interface can be less approachable for beginners.
Verdict: A good option for experienced developers who prefer a Git-and-terminal workflow.
Aider – AI Pair Programming in Your Terminal
7. Continue — Best for Custom AI Workflows
Continue is an open-source approach to AI-assisted development that emphasizes customization.
This can be useful when developers want more control over:
- Models
- Providers
- IDE integration
- Context
- Local workflows
- Privacy
Who should consider it?
Continue is particularly interesting for developers who care more about flexibility than having a completely managed experience.
Limitation
Customization also means more configuration.
Verdict: Worth considering when control and flexibility are more important than simplicity.
What is Continue? | Continue Docs
8. Amazon Q Developer — Best for AWS Developers
Amazon Q Developer is particularly relevant when the application is closely connected to AWS.
Why this matters for debugging
A cloud application can fail because of more than application code.
For example:
Application code
       ↓
AWS API
       ↓
IAM permissions
       ↓
Cloud service
       ↓
Database/storage
A developer may initially blame the application when the actual problem is a permission, configuration, or service issue.
An AWS-focused assistant can be useful when the debugging problem crosses those boundaries.
Best for
- AWS applications
- Cloud development
- AWS SDKs
- Infrastructure-related troubleshooting
- Developers already using AWS services
Limitation
If you rarely use AWS, its ecosystem-specific advantages may not matter.
Verdict: A practical option for developers whose applications depend heavily on AWS.
Coding Assistant – Amazon Q Developer – AWS
9. Windsurf — Best AI-Native IDE Alternative
Windsurf is another AI-focused development environment built around agentic coding.
Its appeal is the combination of:
- Code understanding
- AI assistance
- Multi-file editing
- Agentic workflows
- Integrated development
Who should consider it?
Developers who want an AI-native editor but want to compare alternatives rather than automatically choosing the most popular option.
Limitation
The best AI editor depends heavily on your preferred workflow, models, integrations, and usage limits.
Verdict: A strong alternative for developers looking for an AI-first development environment.
windsurf.com/account/onboarding?page=editor
10. Sourcegraph Cody — Best for Large Codebases
Large repositories create a different debugging challenge.
The problem is often not:
“What does this function do?”
It is:
“Where else is this function used, and which service depends on its behavior?”
Why repository search matters
Large-codebase debugging may require finding:
- Function definitions
- Call sites
- Interfaces
- Configuration
- Tests
- Documentation
- Related services
Strong code search can reduce the time spent manually navigating a large repository.
Best for
- Large codebases
- Enterprise repositories
- Multi-service applications
- Developers who frequently need repository-wide context
Limitation
The benefits become less noticeable for a small project with only a few dozen files.
Verdict: Most interesting when repository size itself is a debugging problem.
Detailed AI Debugging Tool Comparison
| Tool | Best use | Local debugging | Multi-file context | Tests | Production focus | Open source |
|---|---|---|---|---|---|---|
| Cursor | General development | Excellent | Strong | Strong | Limited | No |
| Claude Code | Complex investigation | Excellent | Strong | Strong | Limited | No |
| GitHub Copilot | IDE/GitHub workflow | Strong | Strong | Strong | Limited | No |
| Sentry | Production issues | Limited | Runtime-focused | N/A | Excellent | No |
| CodeRabbit | PR review | Limited | Review-focused | Strong | No | No |
| Aider | Git/terminal workflow | Strong | Strong | Strong | No | Yes |
| Continue | Custom workflows | Strong | Configurable | Configurable | No | Yes |
| Amazon Q Developer | AWS | Strong | Strong | Strong | AWS-focused | No |
| Windsurf | AI-native IDE | Strong | Strong | Strong | Limited | No |
| Sourcegraph Cody | Large repositories | Strong | Strong | Strong | Limited | No |
How to read this table: “Strong” does not mean every plan or version provides exactly the same capability. Features and limits can change, so verify the current product documentation before making a purchasing decision.
A tool may understand Python syntax very well but still struggle with the particular framework, database, deployment environment, or architecture used by your application.
| Language or stack | Debugging features to prioritize |
|---|---|
| JavaScript | Runtime errors, browser errors, npm dependencies |
| TypeScript | Type errors, build errors, repository context |
| Python | Tracebacks, tests, dependency problems |
| Java | Stack traces, build tools, tests |
| PHP | Framework context, server logs, database errors |
| C/C++ | Compiler errors, memory problems, debugger integration |
| Go | Compiler errors, tests, concurrency issues |
| Rust | Compiler diagnostics, ownership and lifetime errors |
| React | Component state, rendering, API calls |
| Node.js | Async errors, APIs, dependencies, logs |
Best AI Tools for Common Types of Bugs
Syntax errors
These are usually straightforward.
Examples include:
Unexpected token
SyntaxError
Missing bracket
Invalid syntax
AI can often identify the problem quickly.
Runtime errors
Runtime bugs are more interesting because the code is syntactically valid.
Examples:
TypeError
NullPointerException
KeyError
Undefined variable
Provide the complete stack trace whenever possible.
Logic errors
Logic bugs are harder because the program may run without producing an obvious exception.
For example:
Expected total: ₹500
Actual total: ₹750
The AI needs to understand the intended behavior, not just identify invalid syntax.
Tell it:
- What should happen
- What actually happens
- How to reproduce the issue
API errors
Include:
- HTTP method
- Endpoint
- Status code
- Response body
- Request structure
- Relevant server logs
Never include real API keys or authentication tokens.
Database errors
Database problems can involve several layers:
Application
    ↓
ORM/query builder
    ↓
SQL
    ↓
Database
The visible error may occur in one layer while the root cause is somewhere else.
Performance problems
AI can help interpret profiling data and identify suspicious code, but performance problems should be measured rather than guessed.
Useful evidence includes:
- CPU usage
- Memory usage
- Query time
- Network latency
- Traces
- Profiling data
Failing tests
Tests are one of the best inputs for AI debugging because they provide a measurable target.
Instead of:
“Fix my application.”
try:
“This test expected a 200 response but received 500. Find the root cause and make the smallest change necessary to restore the expected behavior.”
Local Debugging vs. Production Debugging
Local debugging
Local debugging usually involves:
- Source code
- Terminal output
- Unit tests
- Browser console
- Local logs
- Development tools
AI coding assistants are particularly useful here.
Production debugging
Production debugging requires additional context.
For example:
User request
     ↓
Load balancer
     ↓
Application
     ↓
Database
     ↓
Third-party API
A failure could occur anywhere in that chain.
Why production bugs are harder
A production-only problem may depend on:
- Real user data
- A particular region
- Traffic volume
- Deployment configuration
- Environment variables
- Database state
- Third-party services
- Timing
This is why production observability tools can complement AI coding assistants.
Practical Example: Debugging a React Error With AI
Consider this code:
const username = user.profile.name;
The application throws:
TypeError: Cannot read properties of undefined
A beginner might immediately ask an AI:
“Fix this error.”
The AI might suggest:
const username = user?.profile?.name;
That could stop the crash.
But it might also hide the real problem.
A better investigation
Ask:
- Where does
usercome from? - When does the API request finish?
- What does the API actually return?
- Does
profilealways exist? - Is the component rendering before the data arrives?
- What should the UI show while data is loading?
- What should happen if the profile does not exist?
Maybe the correct solution is actually:
if (loading) {
    return <Loading />;
}

if (!user) {
    return <LoginRequired />;
}
The important lesson is:
A disappearing error does not necessarily mean the bug has been fixed.
A good AI debugging workflow should investigate the cause before changing the code.
How to Use AI to Debug Code
1. Reproduce the problem
Before asking AI for a fix, make sure you can reproduce the issue.
Write down the exact steps.
2. Capture the complete error
Instead of:
“My app is crashing.”
provide:
Error:
TypeError: Cannot read properties of undefined

Location:
src/components/Profile.jsx:42

Expected:
The profile page should show the user's name.

Actual:
The page crashes after the API request completes.
3. Provide relevant context
Include:
- Language
- Framework
- Version
- Relevant dependencies
- Environment
- Recent changes
4. Ask for diagnosis before asking for a fix
A useful prompt is:
“Identify the three most likely causes of this error. Explain what evidence supports each possibility. Do not change the code yet.”
This encourages investigation.
5. Ask for the smallest safe fix
Once the root cause is understood:
“Propose the smallest change that fixes the underlying problem without changing unrelated behavior.”
6. Test the fix
Run the original failing test.
7. Run regression tests
A successful fix should not break another feature.
8. Review the final diff
Read the code yourself.
Ask:
- Did the AI change unrelated files?
- Did it remove validation?
- Did it introduce a security problem?
- Does the fix match the application’s intended behavior?
- Is there a regression test?
A Better AI Debugging Prompt
A weak prompt:
Fix my code.
A better prompt:
I am debugging a React application.

Environment:
- React:
- Node.js:
- Browser:

Expected behavior:
The profile page should display the user's name.

Actual behavior:
The page crashes after the API response arrives.

Error:
TypeError: Cannot read properties of undefined

Stack trace:
[Paste the complete stack trace]

Recent change:
I changed the API response handling yesterday.

Please:
1. Identify the most likely root cause.
2. Explain the data flow that leads to the error.
3. Inspect the relevant files before suggesting changes.
4. Propose the smallest safe fix.
5. Explain any side effects.
6. Suggest a regression test.
7. Do not change unrelated code.
This type of prompt gives the AI enough information to investigate instead of guessing.
Are AI Debugging Tools Reliable? AI debugging can save significant time, but it should not be treated as an authority.
When AI debugging works well
AI is generally more useful when:
- The problem is reproducible
- The error message is clear
- The relevant code is available
- Tests exist
- Logs are available
- Expected behavior is clearly defined
When AI debugging struggles
Be more cautious when:
- The problem is intermittent
- The requirements are unclear
- Tests are missing
- The bug depends on production traffic
- External services are involved
- The logs are incomplete
- The error message is misleading
Why AI can suggest the wrong fix
AI does not automatically know your business rules.
For example, it might suggest:
if (!user) {
    return;
}
That may prevent an exception.
But what if a user is required at that point in the application?
The change has hidden the symptom instead of fixing the underlying problem.
Passing tests is not absolute proof
A test suite can miss:
- Rare inputs
- Browser-specific problems
- Production configuration
- Race conditions
- Third-party service failures
- Unusual user behavior
Treat AI-generated changes as code that needs review, testing, and validation.
Security and Privacy When Using AI for Debugging
This is one area developers should not overlook.
Debugging information can contain sensitive data.
Never paste secrets into an AI tool
Do not expose:
API keys
Passwords
Database credentials
Private SSH keys
Authentication tokens
JWT secrets
Payment information
If a secret is accidentally exposed, rotate it rather than assuming that deleting the message solves the problem.
Be careful with production logs
Logs may contain:
- Email addresses
- User IDs
- IP addresses
- Database values
- Internal URLs
- Session information
- Authentication data
Remove unnecessary sensitive information before sharing logs.
Check the provider’s privacy policy
Do not assume all AI tools handle code in the same way.
For example, Cursor documents a Privacy Mode and explains how code data is handled when that mode is enabled.
The correct approach is to review the current privacy and enterprise documentation for whichever tool you choose.
Practical security checklist
Before using an AI debugging tool with a real project:
- Enable appropriate privacy controls.
- Remove secrets from logs.
- Avoid unnecessary customer data.
- Use synthetic data when practical.
- Understand retention and training policies.
- Review generated code.
- Limit repository access where possible.
- Follow your organization’s AI policy.
How to Choose the Right AI Debugging Tool
The best question is not:
“Which AI tool is the most powerful?”
Ask:
“Where do most of my bugs happen?”
Choose an IDE-based tool if…
You spend most of your time debugging local code.
Consider:
- Cursor
- GitHub Copilot
- Windsurf
Choose a terminal-based tool if…
You frequently work with:
- Git
- Shell commands
- Test runners
- Build tools
- Package managers
Consider:
- Claude Code
- Aider
Choose a production debugging platform if…
Your biggest question is:
“Why are real users experiencing this error?”
Consider:
- Sentry
- Other observability platforms with AI-assisted investigation
Choose an AI code-review tool if…
You want to catch bugs before they reach production.
Consider:
- CodeRabbit
- Cursor Bugbot
Choose an open-source/customizable tool if…
You want more control over:
- Models
- Providers
- IDE integration
- Local workflows
- Privacy
Consider:
- Aider
- Continue
AI Debugging Tools: Pricing Considerations
Pricing changes frequently, and many AI development tools now combine subscriptions with usage limits or usage-based billing.
For that reason, compare what you actually get for the price, not just the monthly subscription.
| Tool | Pricing approach |
|---|---|
| Cursor | Subscription + included model usage + possible additional usage |
| Claude Code | Included with applicable Claude plans; usage depends on plan/model |
| GitHub Copilot | Subscription tiers with usage/credit considerations |
| Sentry | Platform-based pricing; AI features depend on current plan |
| CodeRabbit | Subscription and usage-based options |
| Aider | Open-source software; model/API costs depend on provider |
| Continue | Open-source software; model/provider costs depend on setup |
| Amazon Q Developer | AWS pricing and plan structure |
| Windsurf | Subscription/usage structure varies by current plan |
| Sourcegraph Cody | Current pricing varies by offering |
Cursor’s current individual plans include a free Hobby tier and paid tiers beginning at $20/month, while its India-only Start plan costs ₹649/month, tax inclusive. Cursor also uses included usage pools and on-demand usage, so heavy agent use can increase total spending.
The practical lesson is simple:
Don’t choose an AI debugging tool based only on its cheapest plan.
Estimate how often you will use agents, which models you need, and whether your workflow requires production monitoring or code review in addition to local debugging.
Frequently Asked Questions
What is the best AI debugging tool in 2026?
For general local development, Cursor is a strong choice. Claude Code is particularly useful for terminal-based investigation, while Sentry is better suited to production errors.
Can AI actually debug code?
Yes. Modern AI development tools can inspect code, explain errors, analyze stack traces, investigate repositories, suggest changes, and in some cases run tests or commands. Developers should still verify the result.
What is the best free AI debugging tool?
There is no permanent winner because free limits change. Compare the current free plans of tools such as Cursor and GitHub Copilot before choosing.
Is Cursor good for debugging?
Yes. Cursor is particularly useful when the problem requires understanding multiple files and modifying code inside the development environment.
Is Claude Code good for debugging?
Yes. Its terminal-oriented workflow is useful for repository investigation, command execution, testing, and multi-step debugging.
Is GitHub Copilot good for debugging?
Yes. Copilot can help explain errors, modify code, generate tests, and support agentic development workflows.
Which AI is best for fixing coding errors?
It depends on the problem. IDE and terminal agents are useful for local bugs, while production debugging platforms are more appropriate when runtime data is essential.
Can AI find bugs in an entire codebase?
Some modern tools can work with large repository contexts, but effectiveness depends on repository size, architecture, indexing, available context, and the tool itself.
Can AI debug production errors?
Yes, but production debugging requires runtime evidence. Observability platforms can provide information that a source-code-only AI assistant cannot see.
Can AI fix bugs automatically?
Some agentic tools can modify files, run tests, and prepare changes automatically. Automatic modification does not guarantee a correct fix.
Are AI debugging tools safe?
They can be used safely with appropriate controls. Understand the provider’s privacy policy and avoid exposing secrets, credentials, or unnecessary customer data.
Can AI debugging tools replace programmers?
No. AI can automate parts of debugging, but developers still need to understand requirements, evaluate root causes, review changes, test software, and make engineering decisions.
What is the difference between AI debugging and AI code generation?
Code generation starts with something you want to build. Debugging starts with something that is already failing and attempts to identify why.
Which AI debugging tool is best for beginners?
An IDE-based tool such as Cursor or GitHub Copilot is usually easier for beginners than a terminal-first workflow.
Which AI debugging tool is best for VS Code?
GitHub Copilot has a strong VS Code workflow, while several other AI coding tools also integrate with VS Code. Compare current extensions and agent capabilities before choosing.
Which AI debugging tool is best for Python?
Look for strong traceback analysis, test support, dependency awareness, and repository context rather than choosing a tool based solely on its advertised Python support.
Which AI debugging tool is best for JavaScript?
For JavaScript and TypeScript, prioritize support for your runtime, framework, package manager, tests, and repository context.
Can AI debug React applications?
Yes. AI can help investigate React rendering errors, state problems, asynchronous requests, dependency issues, and component relationships. Give it the browser error, stack trace, expected behavior, and relevant data flow.
Read about Which AI Note-Taking Tools for Students in 2026? – nowstrends.com
Become an AI-Powered Software Engineer in 2026: Complete Roadmap
How to choose Backend tool for Mobile App Development in 2026?